Reports & Analytics
See how your bot is doing and grab the leads it collects.
Your bot collects data in two places. Where you look depends on the bot's mode.
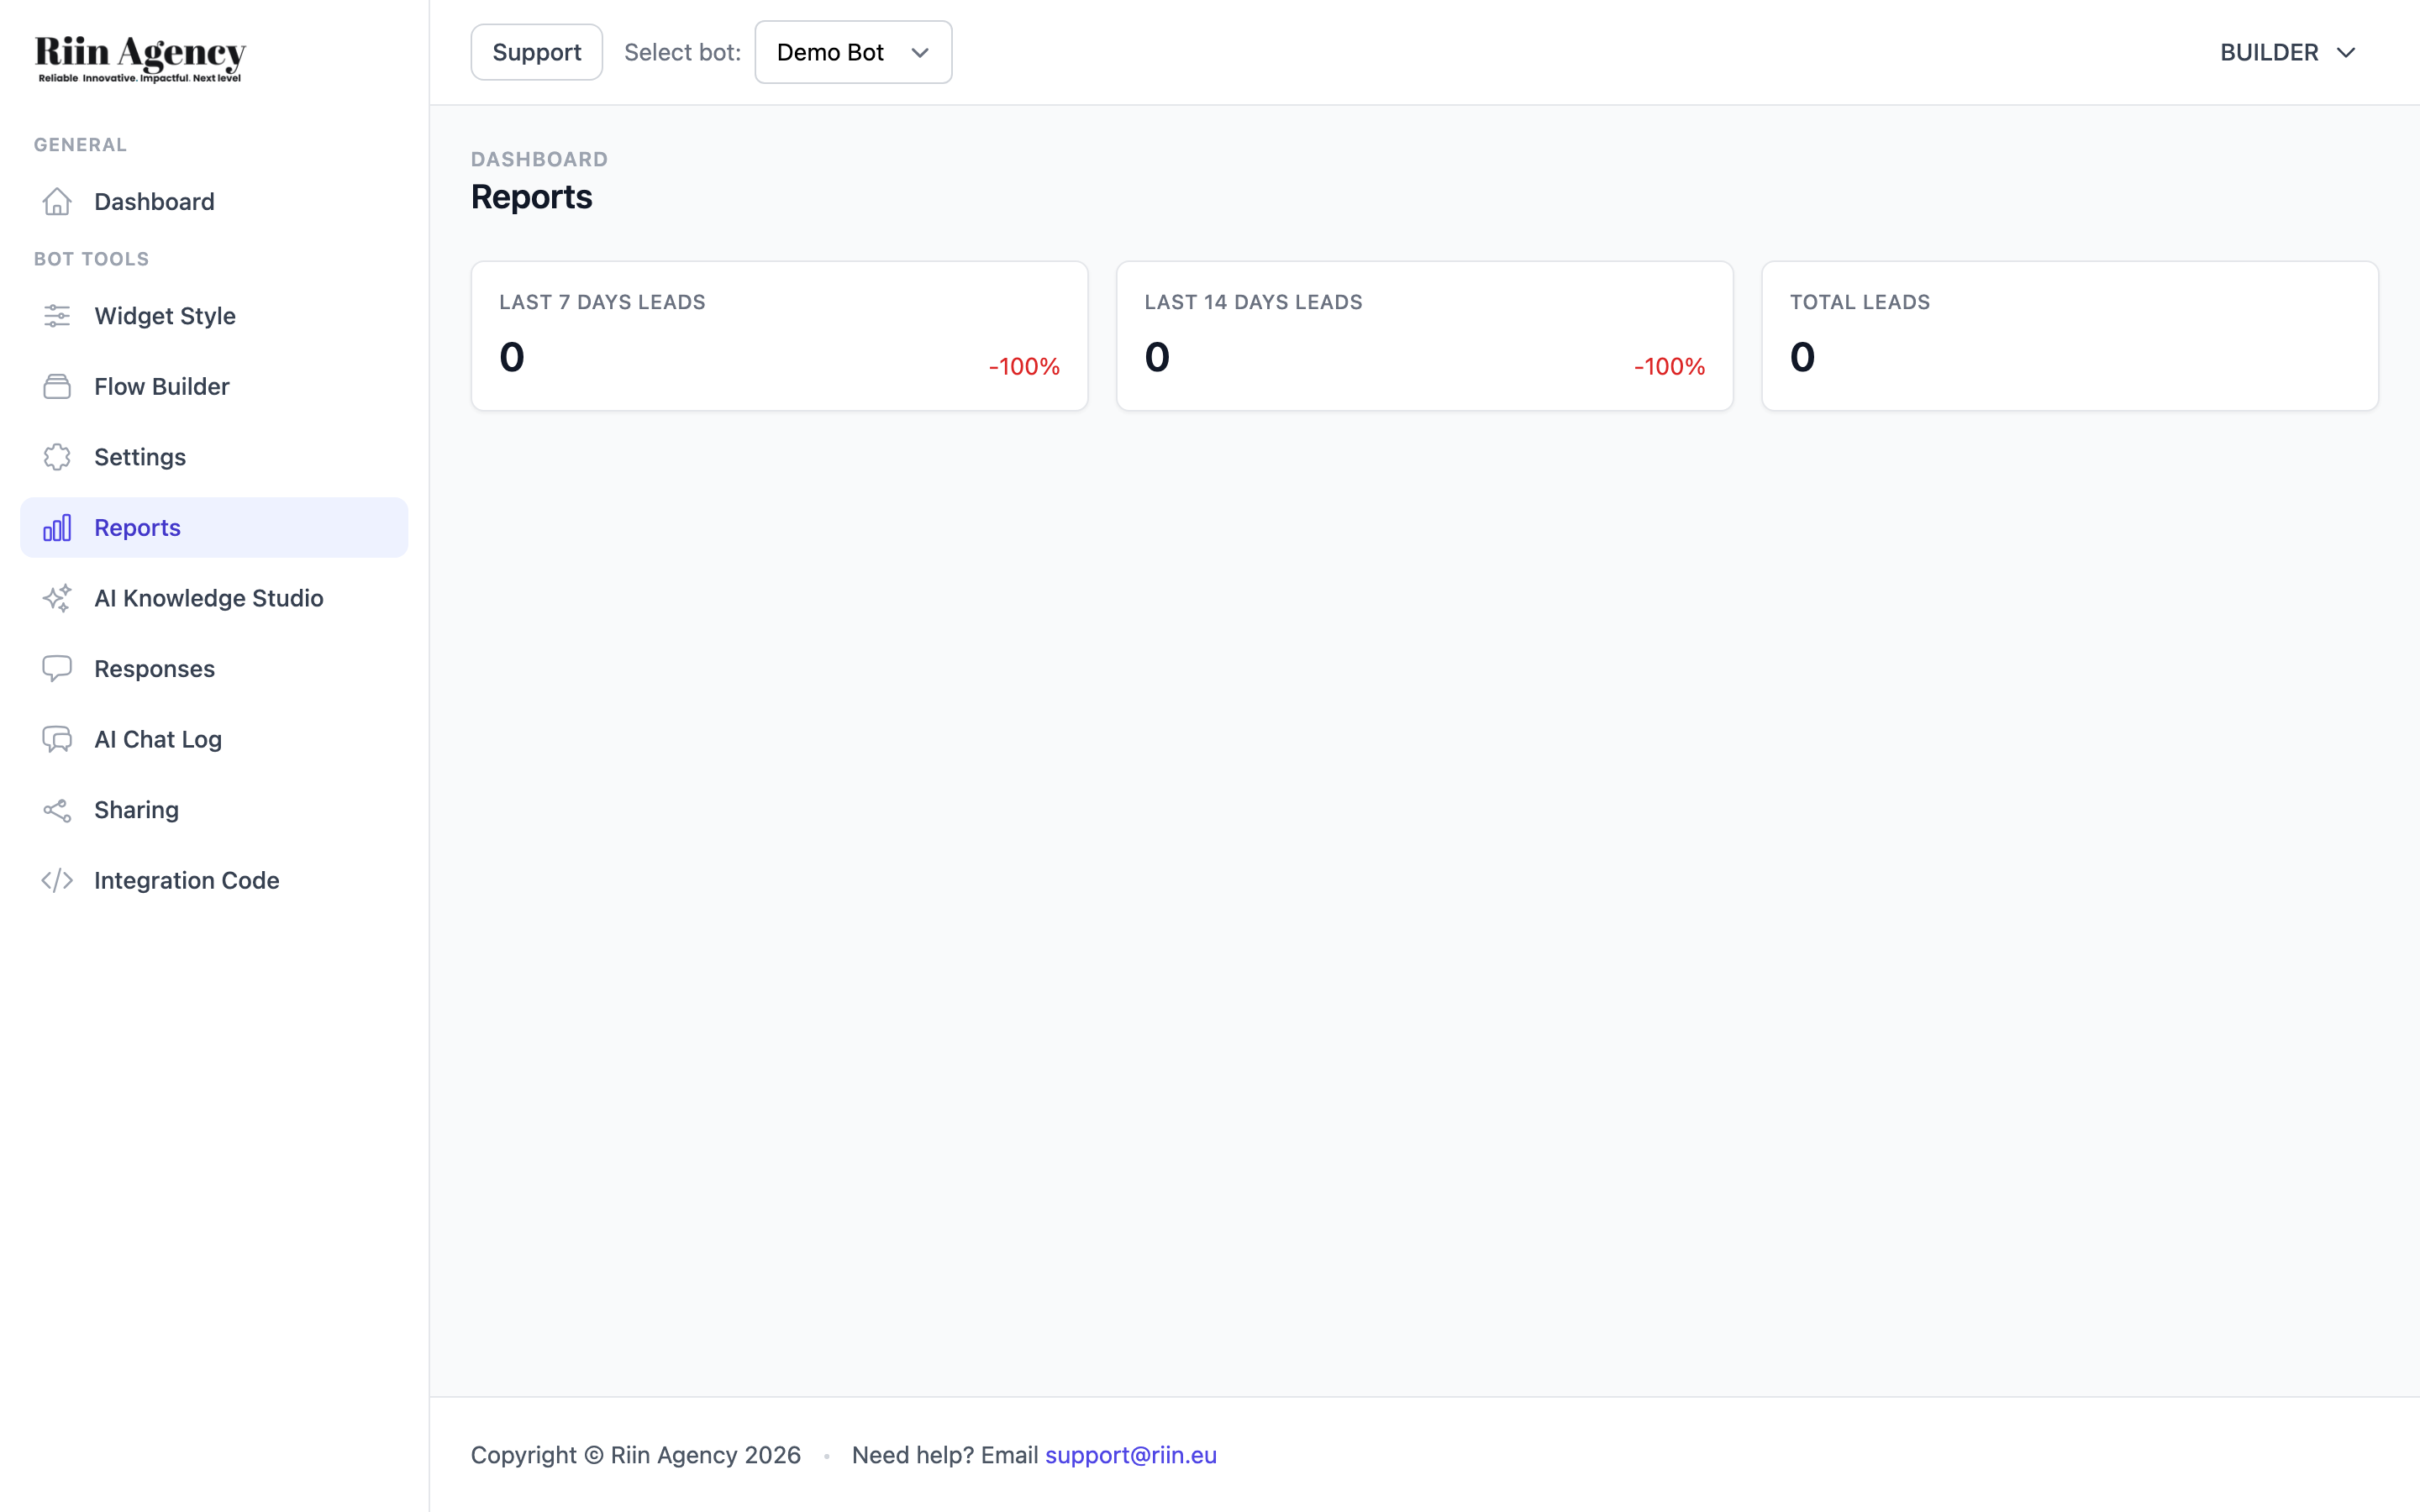
Dashboard overview
The main dashboard shows three numbers at the top:
- Last 7 Days Leads — leads collected in the past week.
- Last 14 Days Leads — leads in the past two weeks.
- Total Leads — leads since the bot started.
The percentage next to each number shows growth or drop vs the previous period.
Where to find chat data
| Bot mode | Where chats live |
|---|---|
| Flow Builder | Responses tab in the left sidebar. Each row is one visitor. Export CSV or Excel. |
| Standalone AI Chat | AI Chat Log tab in the left sidebar. Export logs. |
This trips people up — if you cannot find your chats, check the other tab.
Export
Both tabs let you export everything:
- Responses → Export CSV or Export Excel.
- AI Chat Log → Export Logs.
Use the date filter at the top to pick a range first. You can also select multiple rows and bulk delete old responses.
Tip: If you turned on AI Lead Extraction, the extracted name, email, and phone get their own columns — both in the Responses table and in your Google Sheets integration. One clean row per lead, full conversation included.
Reports per bot
The Reports tab inside a bot shows the same lead numbers, but only for that bot. Useful when you have multiple bots and want to compare.
What to track
For a healthy bot, look at:
- Lead count going up week over week.
- Conversation completion rate — how many visitors finish the flow vs drop off.
- Most common questions — check the AI Chat Log for patterns. Add answers to your AI Knowledge Studio.